General model evaluation#
Overview#
These recipes and diagnostics provide a basic climate model evaluation with observational data. This is especially useful to get an overview of the performance of a simulation. The diagnostics used here allow plotting arbitrary preprocessor output, i.e., arbitrary variables from arbitrary datasets.
Available recipes and diagnostics#
Recipes are stored in recipes/model_evaluation
recipe_model_evaluation_basics.yml
recipe_model_evaluation_clouds_clim.yml
recipe_model_evaluation_clouds_cycles.yml
recipe_model_evaluation_precip_diurnal_cycle.yml
recipe_model_evaluation_precip_hist.yml
recipe_model_evaluation_precip_zonal.yml
Diagnostics are stored in diag_scripts/monitor/
multi_datasets.py: Monitoring diagnostic to show multiple datasets in one plot (incl. biases).
plot_histogram.py: Plotting of 1D histograms with precomputed histogram data (
histogrampreprocessor).hydrology/hour_of_max_precipitation.py: Calculating and plotting hour of maximum precipitation.
User settings#
It is recommended to use a vector graphic file type (e.g., SVG) for the output
format when running this recipe, i.e., run the recipe with the
configuration options output_file_type:
svg.
Note that map and profile plots are rasterized by default.
Use rasterize: false in the recipe to disable
this.
Recipe settings#
A list of all possible configuration options that can be specified in the recipe is given for each diagnostic individually (see links given for the available diagnostics in the previous section).
Variables#
Any, but the variables’ number of dimensions should match the ones expected by each diagnostic (see links given for the available diagnostics in the previous section).
Example plots#
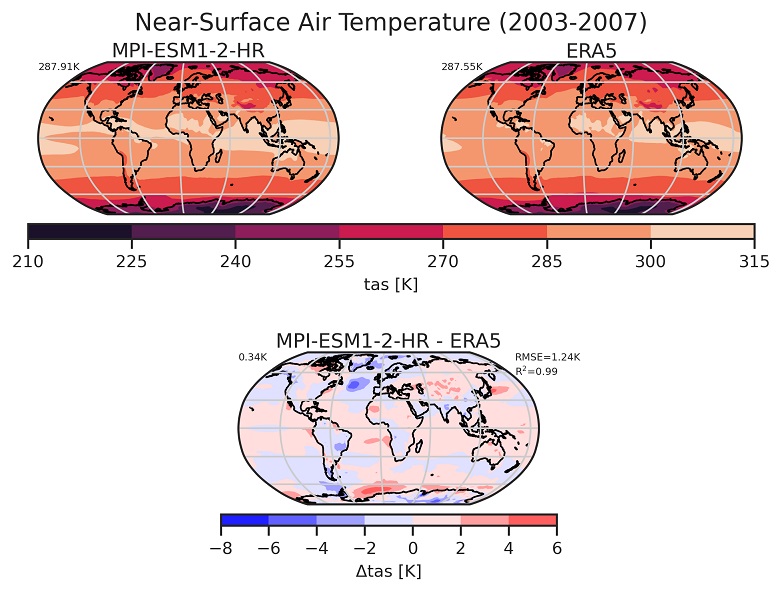
Fig. 101 Global climatology of 2m near-surface air temperature.#
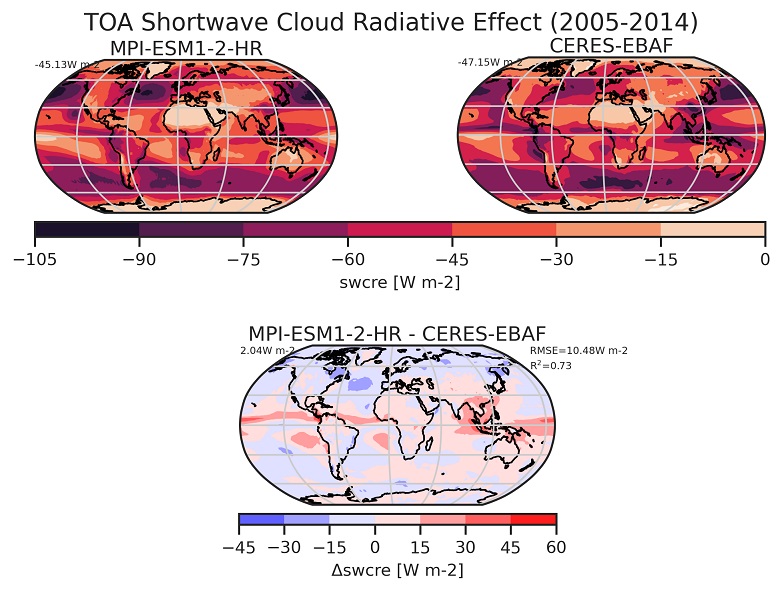
Fig. 102 Global climatology of the shortwave cloud radiative effect (SWCRE).#
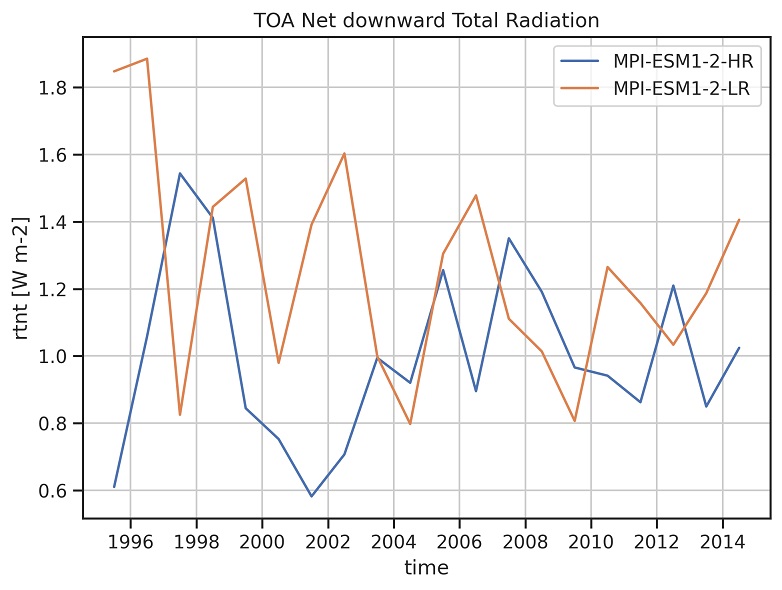
Fig. 103 Time series of the global mean top-of-the-atmosphere net radiative flux.#
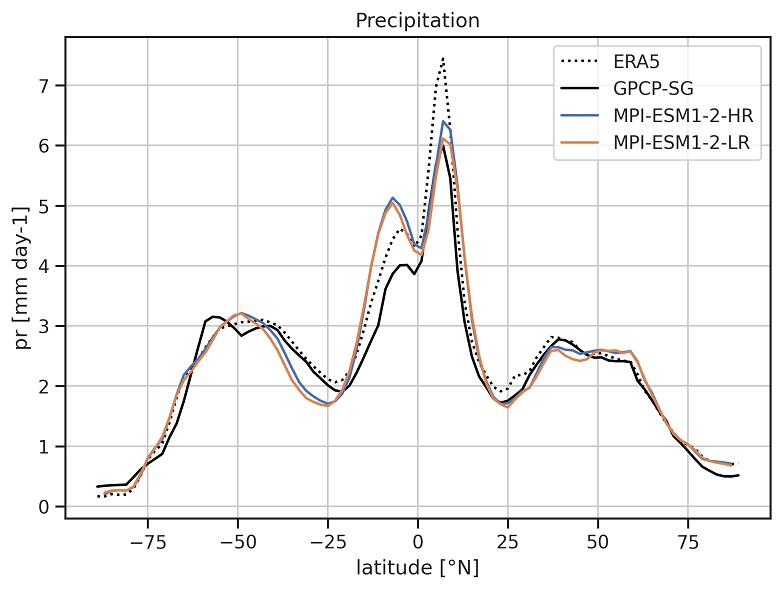
Fig. 104 Zonal mean precipitation.#
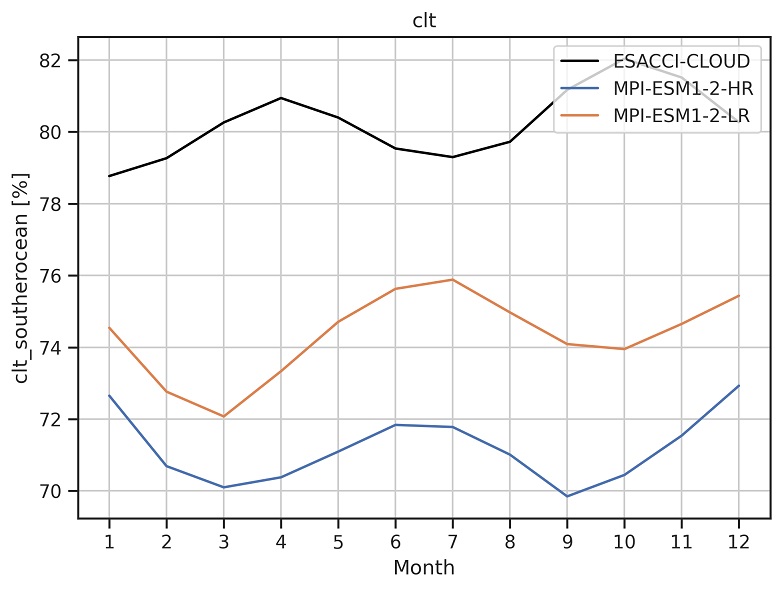
Fig. 105 Annual cycle of Southern Ocean total cloud cover.#
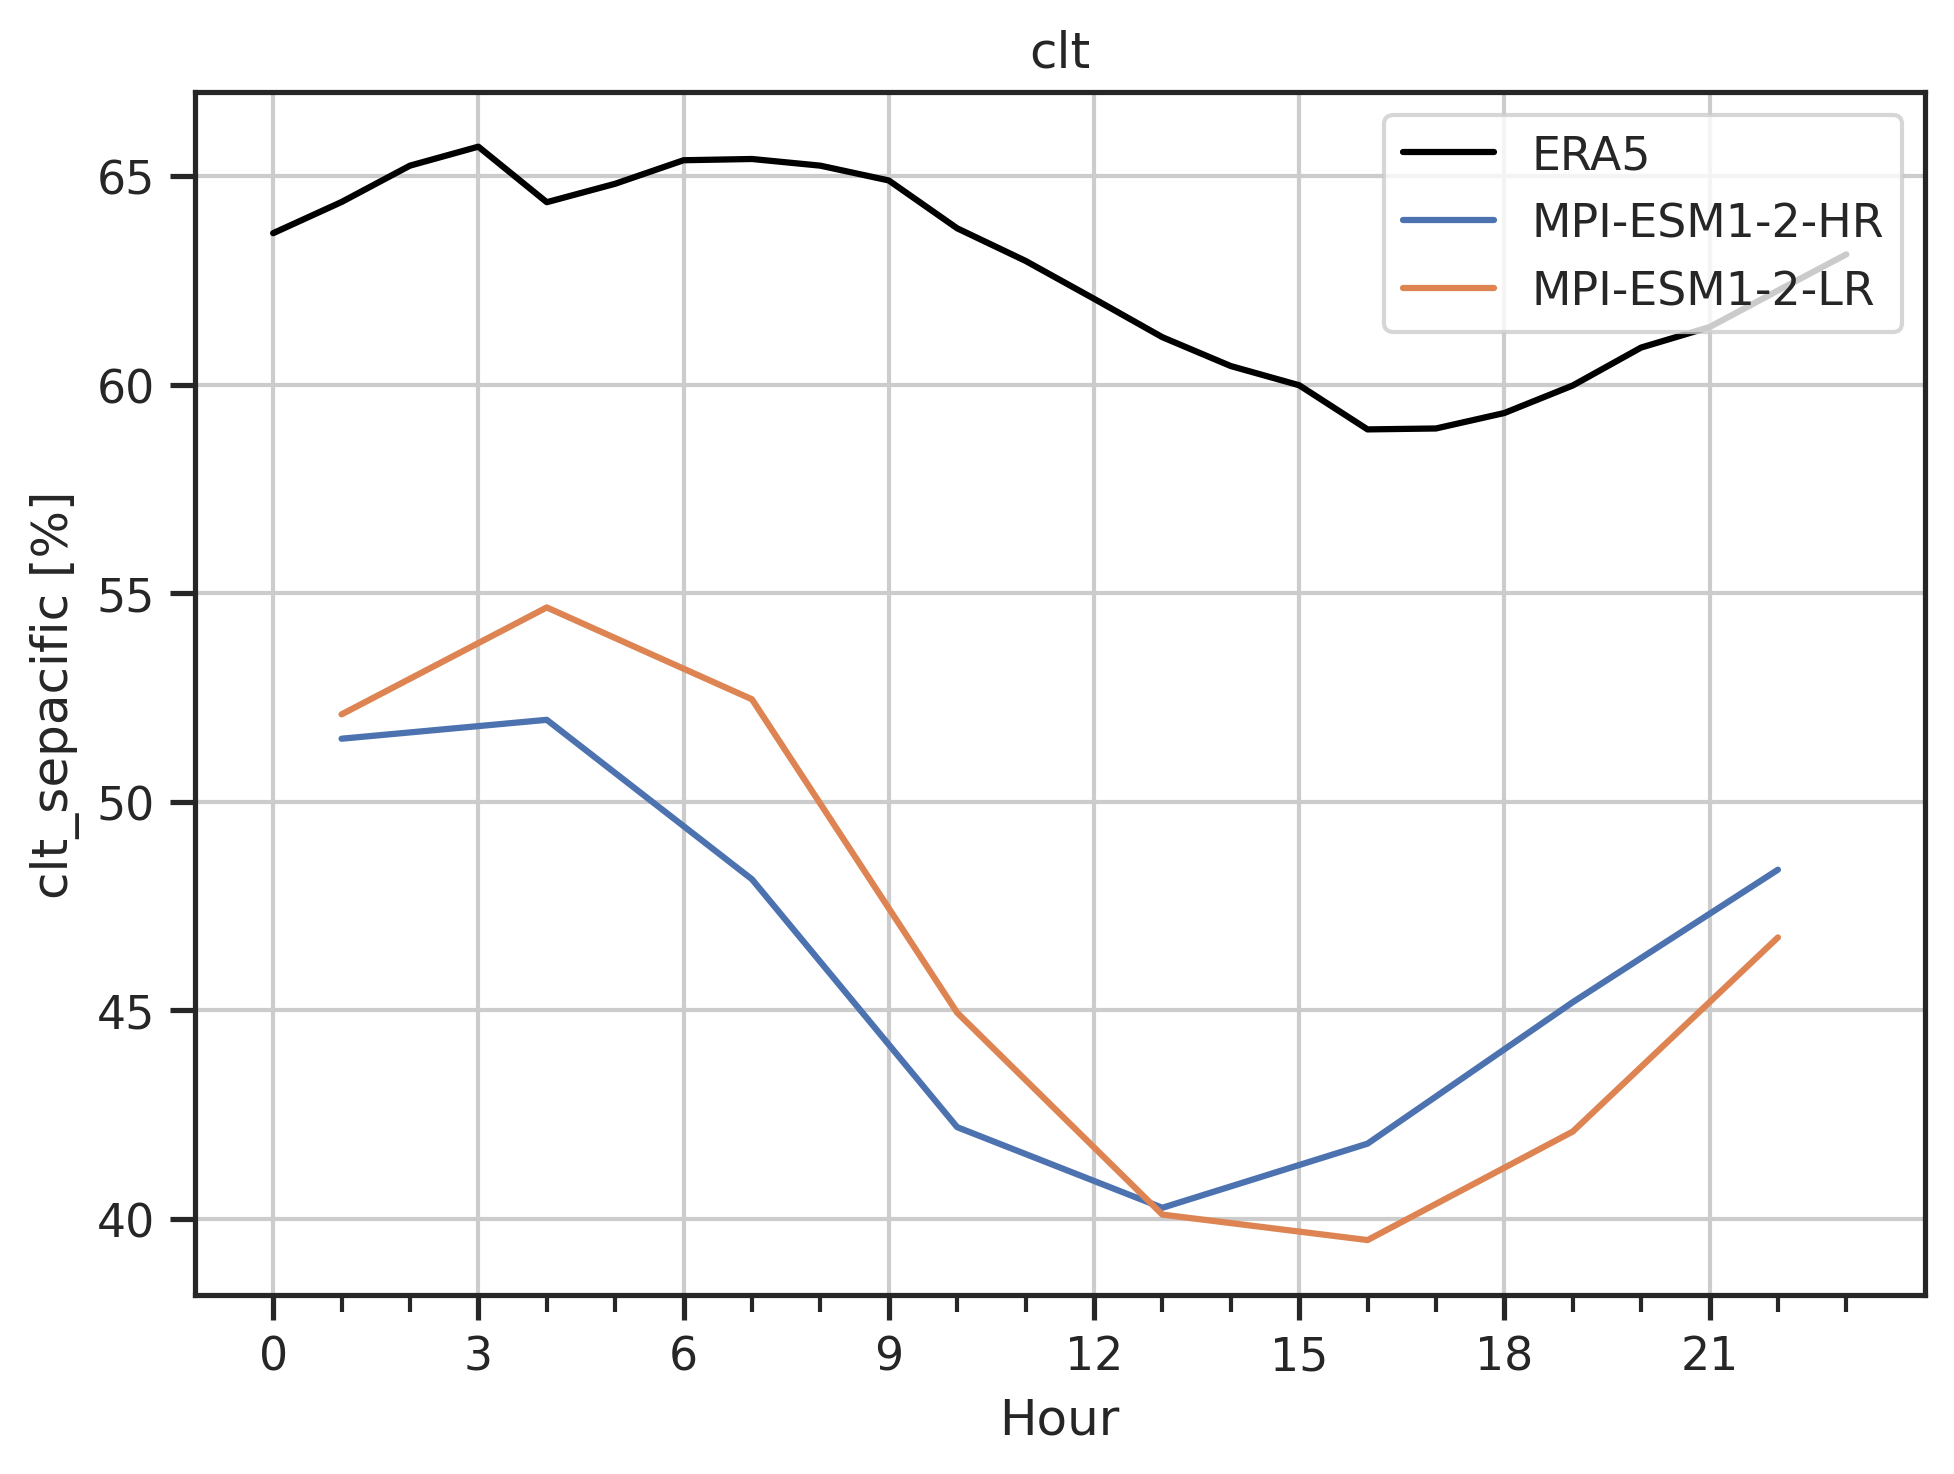
Fig. 106 Diurnal cycle of Southeast Pacific total cloud cover.#
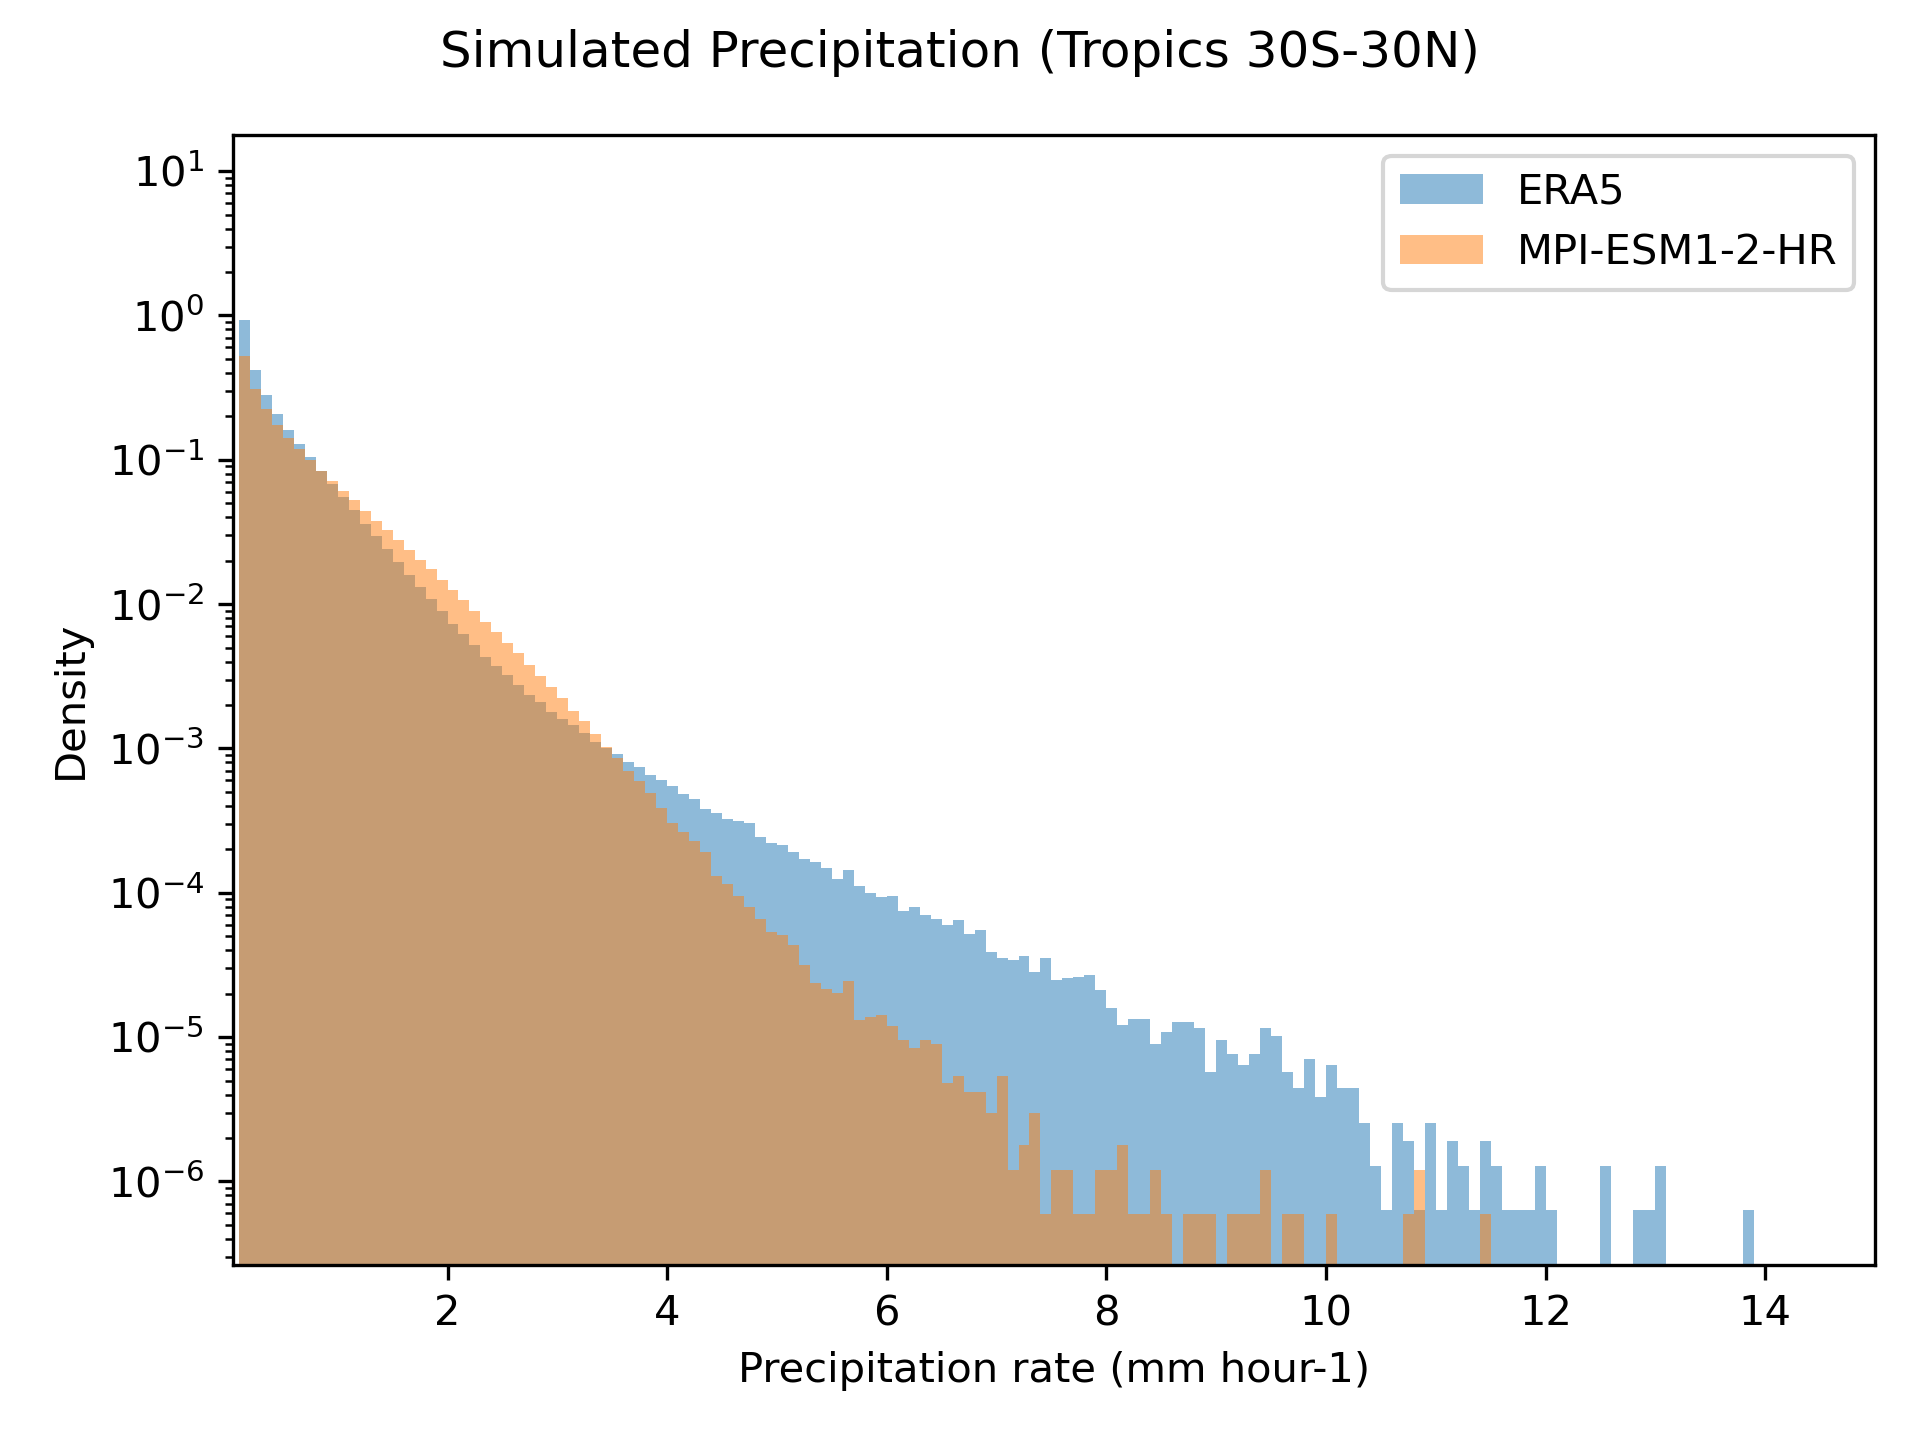
Fig. 107 Histogram of precipitation rates from MPI-ESM1-2-HR and ERA5 reanalysis 3-hourly data over the Tropics (30°S-30°N) for the years 1979-1980.#
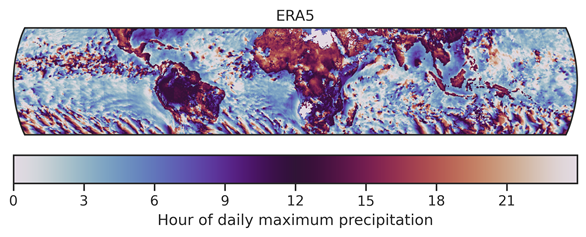
Fig. 108 Hour of maximum precipitation from ERA5 in the tropics (30°S-30°N) for the months June, July, August 2000.#